


Matrixchannel™ Indicators
A hidden matrix guides the destiny of each market. It is a set of lines of force that are present before any market actions, and not dependent on them. These are not trend lines, or Fibonacci ratios, or Gann lines, based on past data.
They can be used as support or resistance levels; or as a timing tool.
They often form clusters, which inhibit market action and create trading ranges. The lines can also give a hint to when the market is free to move quickly.
S&P 500 futures Day Trading Matrixchannel Indicator
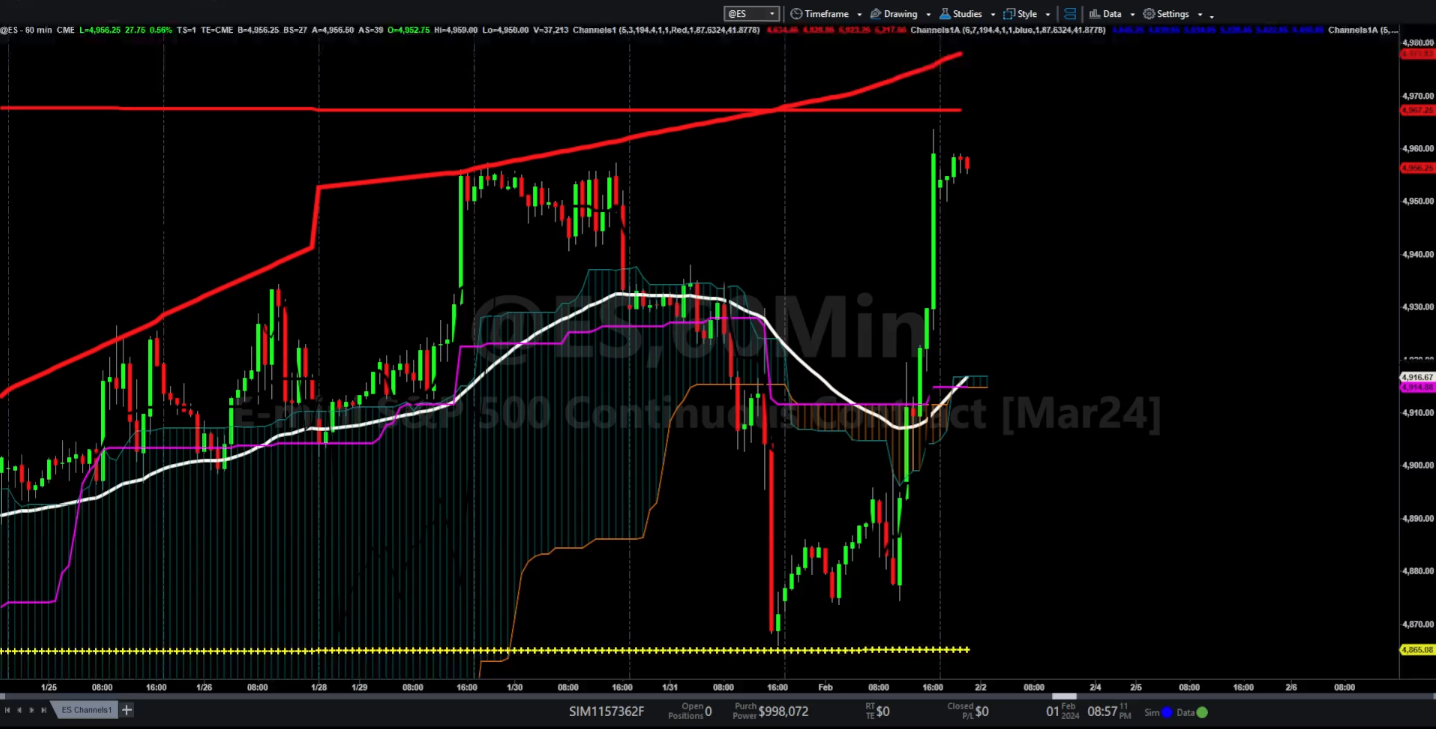
THREE TRADING VIEWS to keep you informed! Watch for when the S&P interacts with the Matrixchannel lines. You decide when to trade and exit. We provide general knowledge on how the S&P market often interacts with the lines, to help with your decision
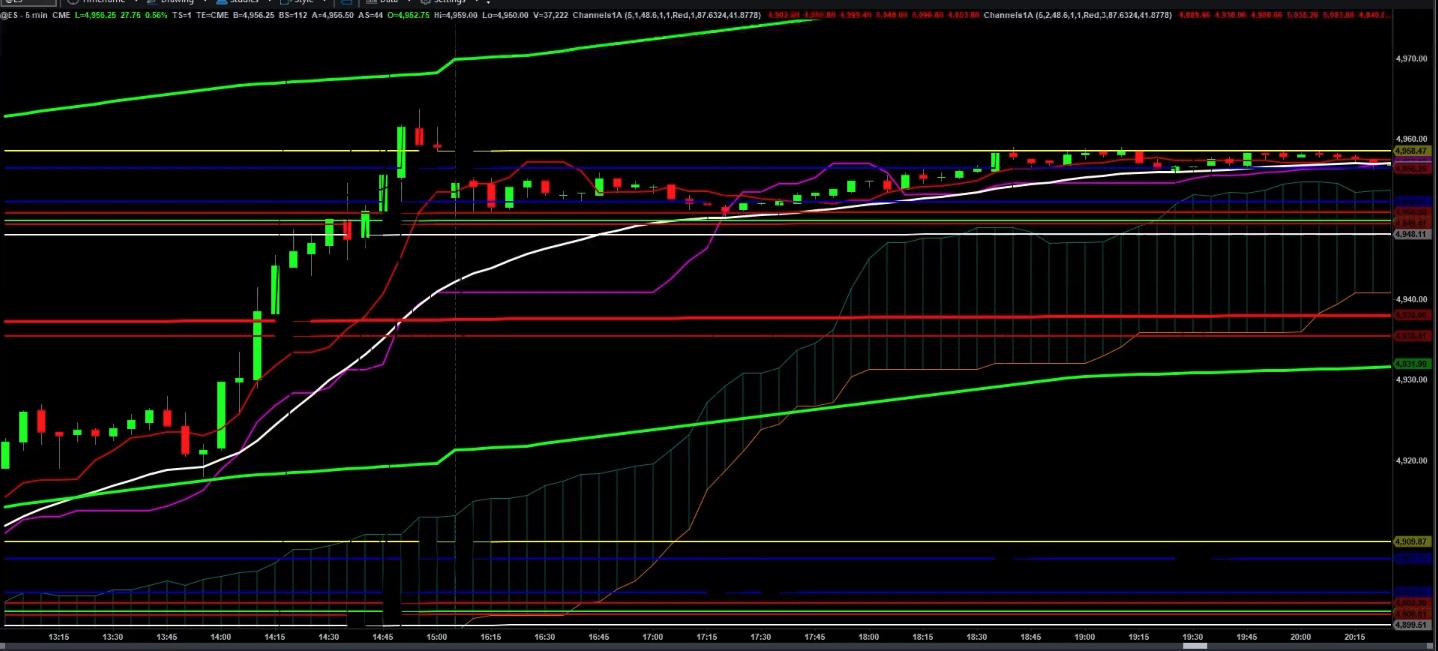
4-hour view, 5-min. bars
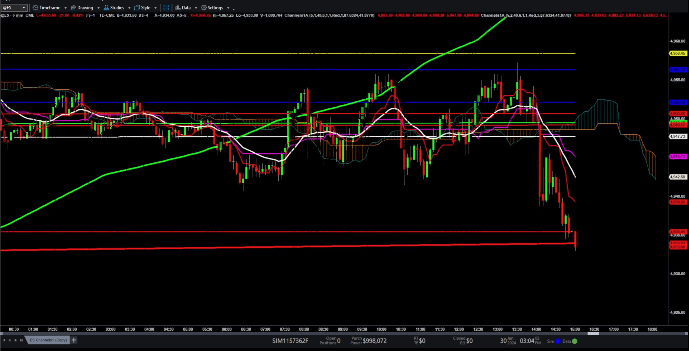
1-day view, 5-minute bars
If you already have an account with us, you will be able to sign in before a purchase
1-week view, 60-minute bars
We can let you know when we add new Indicators
ALSO
Email us with your Indicator recommendations: markets, stocks, or bonds
IndicatorRequest@tradeforecastmastery.com